Unit 2.3 Extracting Information from Data, Pandas
Data connections, trends, and correlation. Pandas is introduced as it could be valuable for PBL, data validation, as well as understanding College Board Topics.


- Files I Got
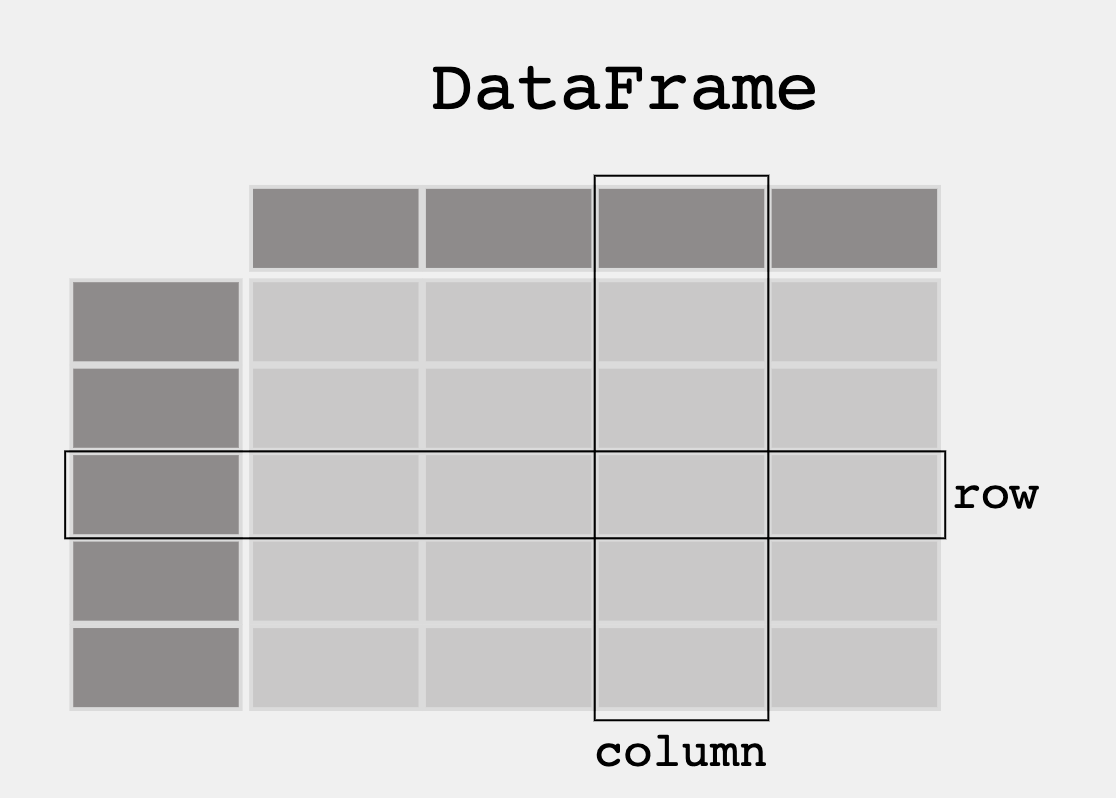
- Pandas and DataFrames
- Cleaning Data
- Extracting Info
- Create your own DataFrame
- APIs are a Source for Writing Programs with Data
Files I Got
wget https://raw.githubusercontent.com/nighthawkcoders/APCSP/master/_notebooks/files/data.csv
wget https://raw.githubusercontent.com/nighthawkcoders/APCSP/master/_notebooks/files/grade.json
wget https://raw.githubusercontent.com/nighthawkcoders/APCSP/master/_notebooks/images/table_dataframe.png
'''Pandas is used to gather data sets through its DataFrames implementation'''
import pandas as pd
df = pd.read_json('files/grade.json')

print(df)
# What part of the data set needs to be cleaned?
# From PBL learning, what is a good time to clean data?  Hint, remember Garbage in, Garbage out?
print(df[['GPA']])

print()

#try two columns and remove the index from print statement
print(df[['Student ID','GPA']].to_string(index=False))
print(df.sort_values(by=['GPA']))

print()

#sort the values in reverse order
print(df.sort_values(by=['GPA'], ascending=False))
print(df[df.GPA > 3.00])
print(df[df.GPA == df.GPA.max()])
print()
print(df[df.GPA == df.GPA.min()])
import pandas as pd

#the data can be stored as a python dictionary
dict = {
  "calories": [420, 380, 390],
  "duration": [50, 40, 45]
}
#stores the data in a data frame
print("-------------Dict_to_DF------------------")
df = pd.DataFrame(dict)
print(df)

print("----------Dict_to_DF_labels--------------")

#or with the index argument, you can label rows.
df = pd.DataFrame(dict, index = ["day1", "day2", "day3"])
print(df)
print("-------Examine Selected Rows---------")
#use a list for multiple labels:
print(df.loc[["day1", "day3"]])

#refer to the row index:
print("--------Examine Single Row-----------")
print(df.loc["day1"])
print(df.info())
'''Pandas can be used to analyze data'''
import pandas as pd
import requests

def fetch():
    '''Obtain data from an endpoint'''
    url = "https://flask.nighthawkcodingsociety.com/api/covid/"
    fetch = requests.get(url)
    json = fetch.json()

    # filter data for requirement
    df = pd.DataFrame(json['countries_stat'])  # filter endpoint for country stats
    print(df.loc[0:5, 'country_name':'deaths']) # show row 0 through 5 and columns country_name through deaths

fetch()
2.3 College Board Practice Problems
(1) A researcher is analyzing data about students in a school district to determine whether there is a relationship between grade point average and number of absences. The researcher plans on compiling data from several sources to create a record for each student.
The researcher has access to a database with the following information about each student.
Last name
First name
Grade level (9, 10, 11, or 12)
Grade point average (on a 0.0 to 4.0 scale)
The researcher also has access to another database with the following information about each student.
First name
Last name
Number of absences from school
Number of late arrivals to school
Upon compiling the data, the researcher identifies a problem due to the fact that neither data source uses a unique ID number for each student. Which of the following best describes the problem caused by the lack of unique ID numbers?
(A) Students who have the same name may be confused with each other.
(B) Students who have the same grade point average may be confused with each other.
(C) Students who have the same grade level may be confused with each other.
(D) Students who have the same number of absences may be confused with each other.
Correct Answer: A
(2) A team of researchers wants to create a program to analyze the amount of pollution reported in roughly 3,000 counties across the United States. The program is intended to combine county data sets and then process the data. Which of the following is most likely to be a challenge in creating the program?
(A) A computer program cannot combine data from different files.
(B) Different counties may organize data in different ways.
(C) The number of counties is too large for the program to process.
(D) The total number of rows of data is too large for the program to process.
Correct Answer: B
(3) A student is creating a Web site that is intended to display information about a city based on a city name that a user enters in a text field. Which of the following are likely to be challenges associated with processing city names that users might provide as input?
Select two answers.
(A) Users might attempt to use the Web site to search for multiple cities.
(B) Users might enter abbreviations for the names of cities.
(C) Users might misspell the name of the city.
(D) Users might be slow at typing a city name in the text field.
Correct Answers: B and C
(4) A database of information about shows at a concert venue contains the following information.
Name of artist performing at the show
Date of show
Total dollar amount of all tickets sold
Which of the following additional pieces of information would be most useful in determining the artist with the greatest attendance during a particular month?
(A) Average ticket price
(B) Length of the show in minutes
(C) Start time of the show
(D) Total dollar amount of food and drinks sold during the show
Correct Answer: A
(5) A camera mounted on the dashboard of a car captures an image of the view from the driver’s seat every second. Each image is stored as data. Along with each image, the camera also captures and stores the car’s speed, the date and time, and the car’s GPS location as metadata. Which of the following can best be determined using only the data and none of the metadata?
(A) The average number of hours per day that the car is in use
(B) The car’s average speed on a particular day
(C) The distance the car traveled on a particular day
(D) The number of bicycles the car passed on a particular day
Correct Answer: D
(6) A teacher sends students an anonymous survey in order to learn more about the students’ work habits. The survey contains the following questions.
On average, how long does homework take you each night (in minutes)?
On average, how long do you study for each test (in minutes)?
Do you enjoy the subject material of this class (yes or no)?
Which of the following questions about the students who responded to the survey can the teacher answer by analyzing the survey results?
I. Do students who enjoy the subject material tend to spend more time on homework each night than the other students do?
II. Do students who spend more time on homework each night tend to spend less time studying for tests than the other students do?
III. Do students who spend more time studying for tests tend to earn higher grades in the class than the other students do?
(A) I only
(B) III only
(C) I and II
(D) I and III
Correct Answer: C
import pandas as pd
df = pd.read_json('files/bmi.json')

print(df)
print(df[['bmi']])

print()

#try two columns and remove the index from print statement
print(df[['Name','Weight','Height','bmi']].to_string(index=False))
print(df[df.bmi == df.bmi.max()])
print()
print(df[df.bmi == df.bmi.min()])